 Dineator
You cannot manage what you do not measure
Most owners have a feeling for how the restaurant is doing, but feelings can be wrong. A handful of simple numbers, tracked consistently, show you what is really happening and where to act. You do not need a wall of charts, only the few that matter.
Start with metrics you can act on, and add more only when you have a question they answer.
Sales and average order value
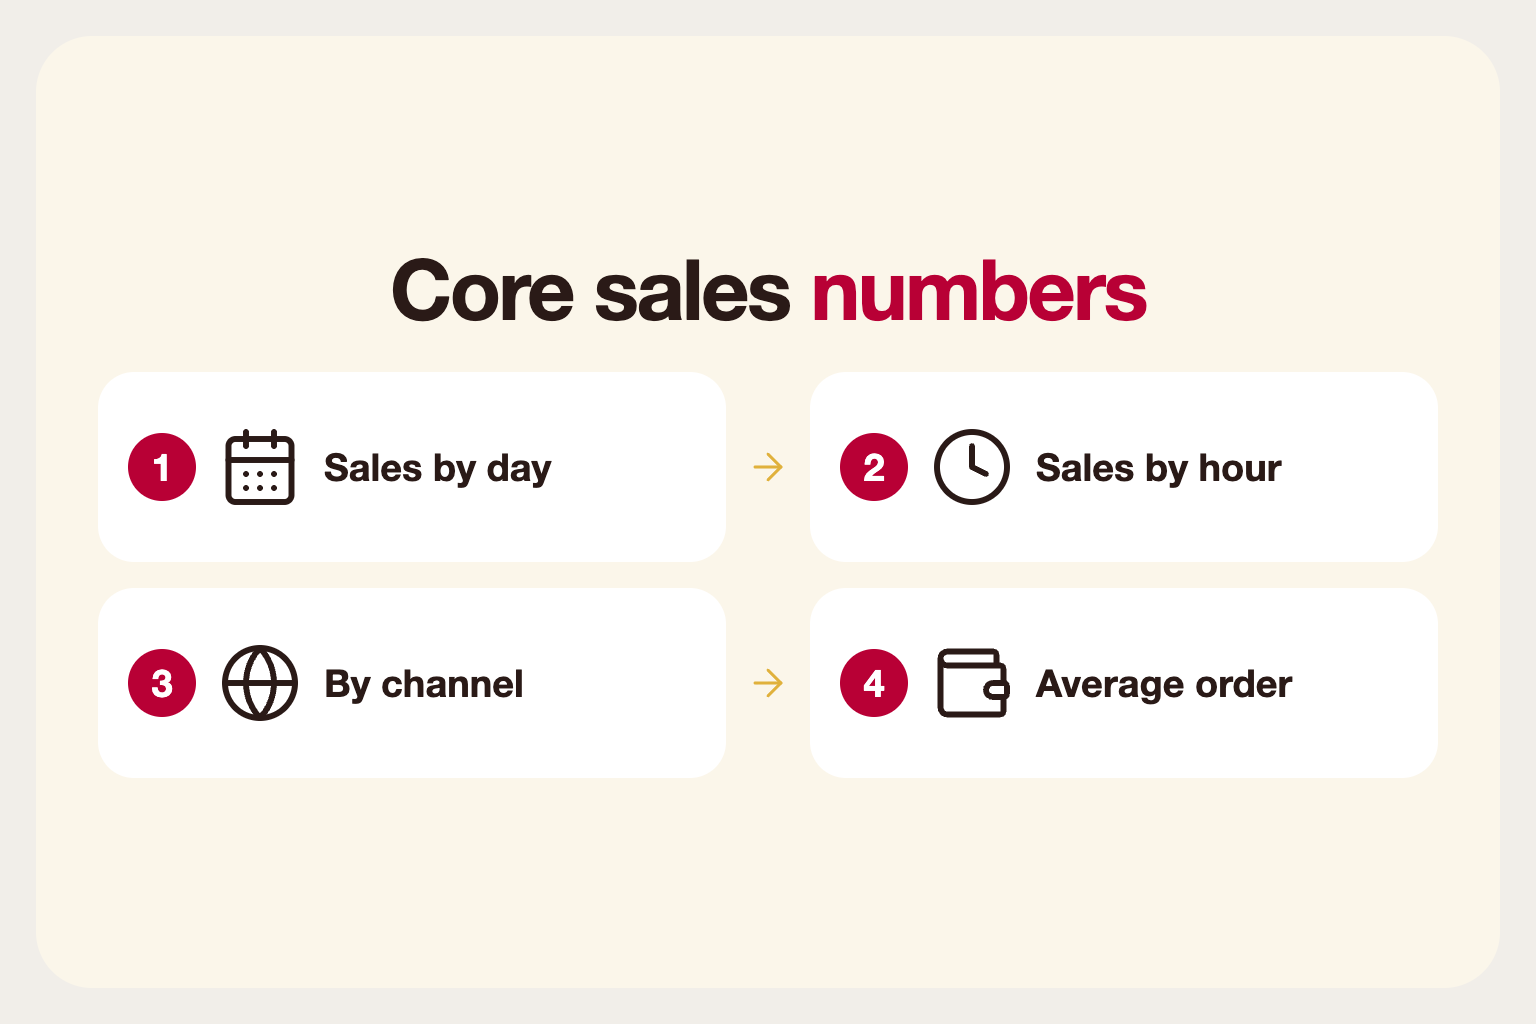
Total sales tell you the size of the business, but the pieces matter more: sales by day, by hour and by channel. Look at average order value too. A rise in average spend can mean guests are adding drinks and desserts, or that prices work.
Compare like with like: this Friday with last Friday, not with a Monday.
Food cost and waste
Food cost as a percentage of sales shows whether you are making money on what you sell. Track it weekly alongside waste. If food cost rises without a change in the menu, the cause is usually portioning, waste or supplier prices.
Keep the process simple and consistent, so that changes in the number mean something.
Labour percentage
Labour cost against sales is a core health check. Watch it by day and shift, not only in total. A week that looks fine overall can hide a loss-making quiet shift.
Combine it with service data. A low labour percentage is only good if guests are still well served.
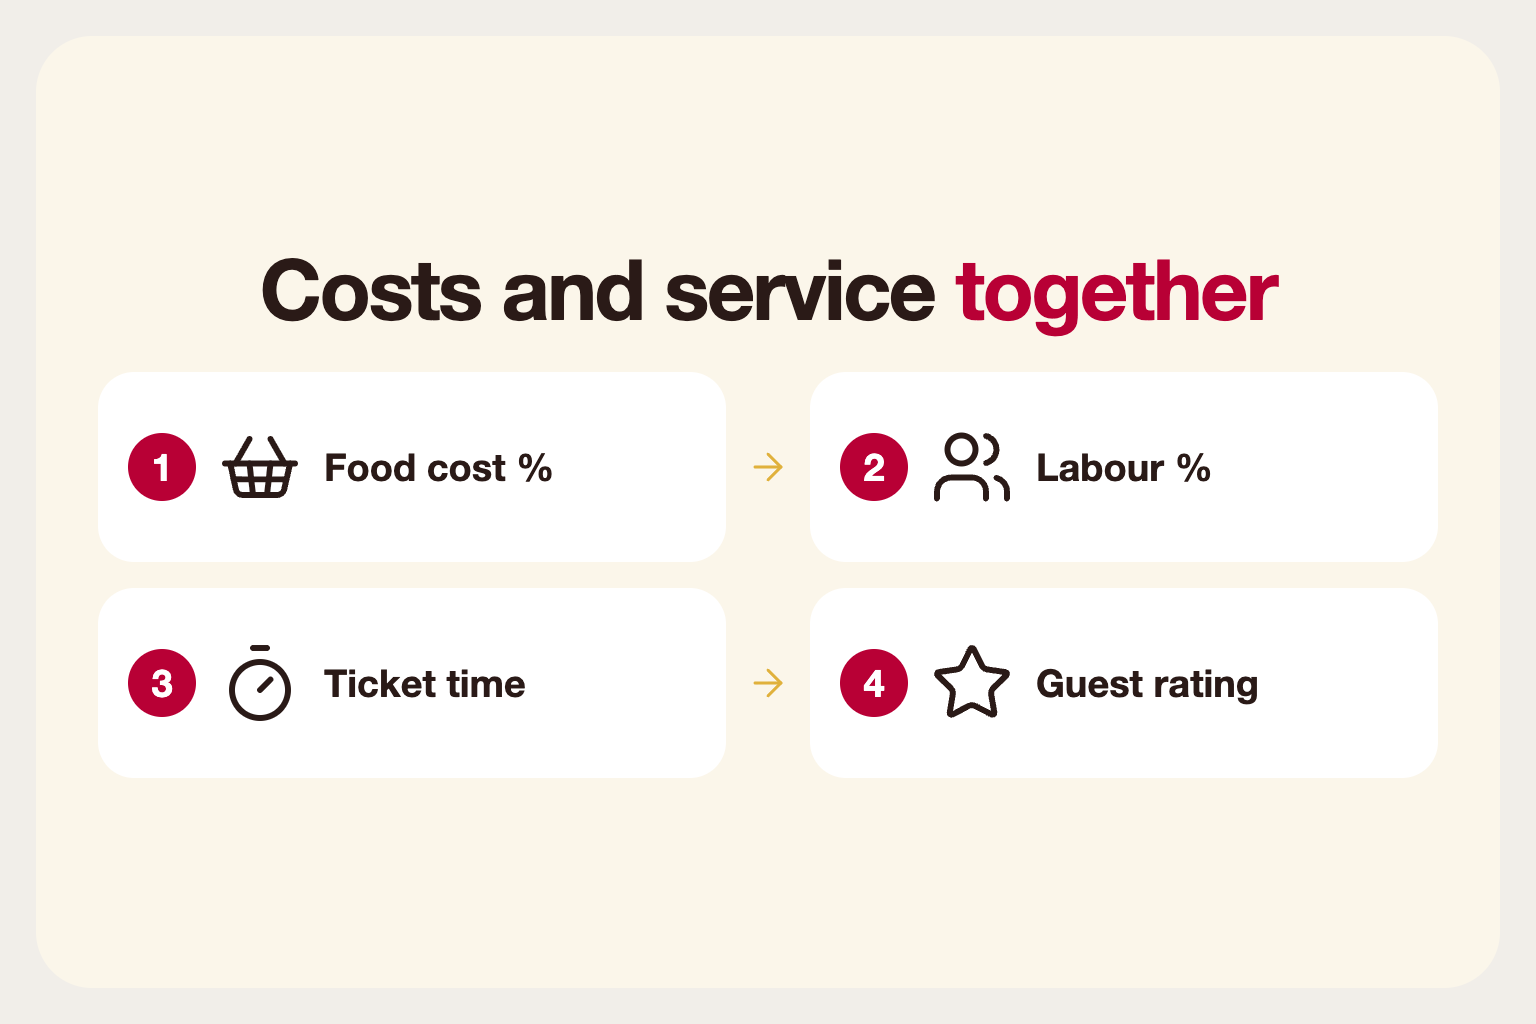
Table and kitchen speed
Table turn time and kitchen ticket time show how smoothly the restaurant runs. Long ticket times point to a bottleneck in a station or a menu that is too complex. Long table times point to waiting at the start or the end of the meal.
Improvements here raise capacity without raising costs.
Guest metrics
Track how many guests are new and how many return, how often they visit and how they rate you. Repeat guests are your cheapest revenue, so watch the rate at which they come back.
Reservation no-show rate and online review ratings round out the picture of how guests feel.
Pick a rhythm
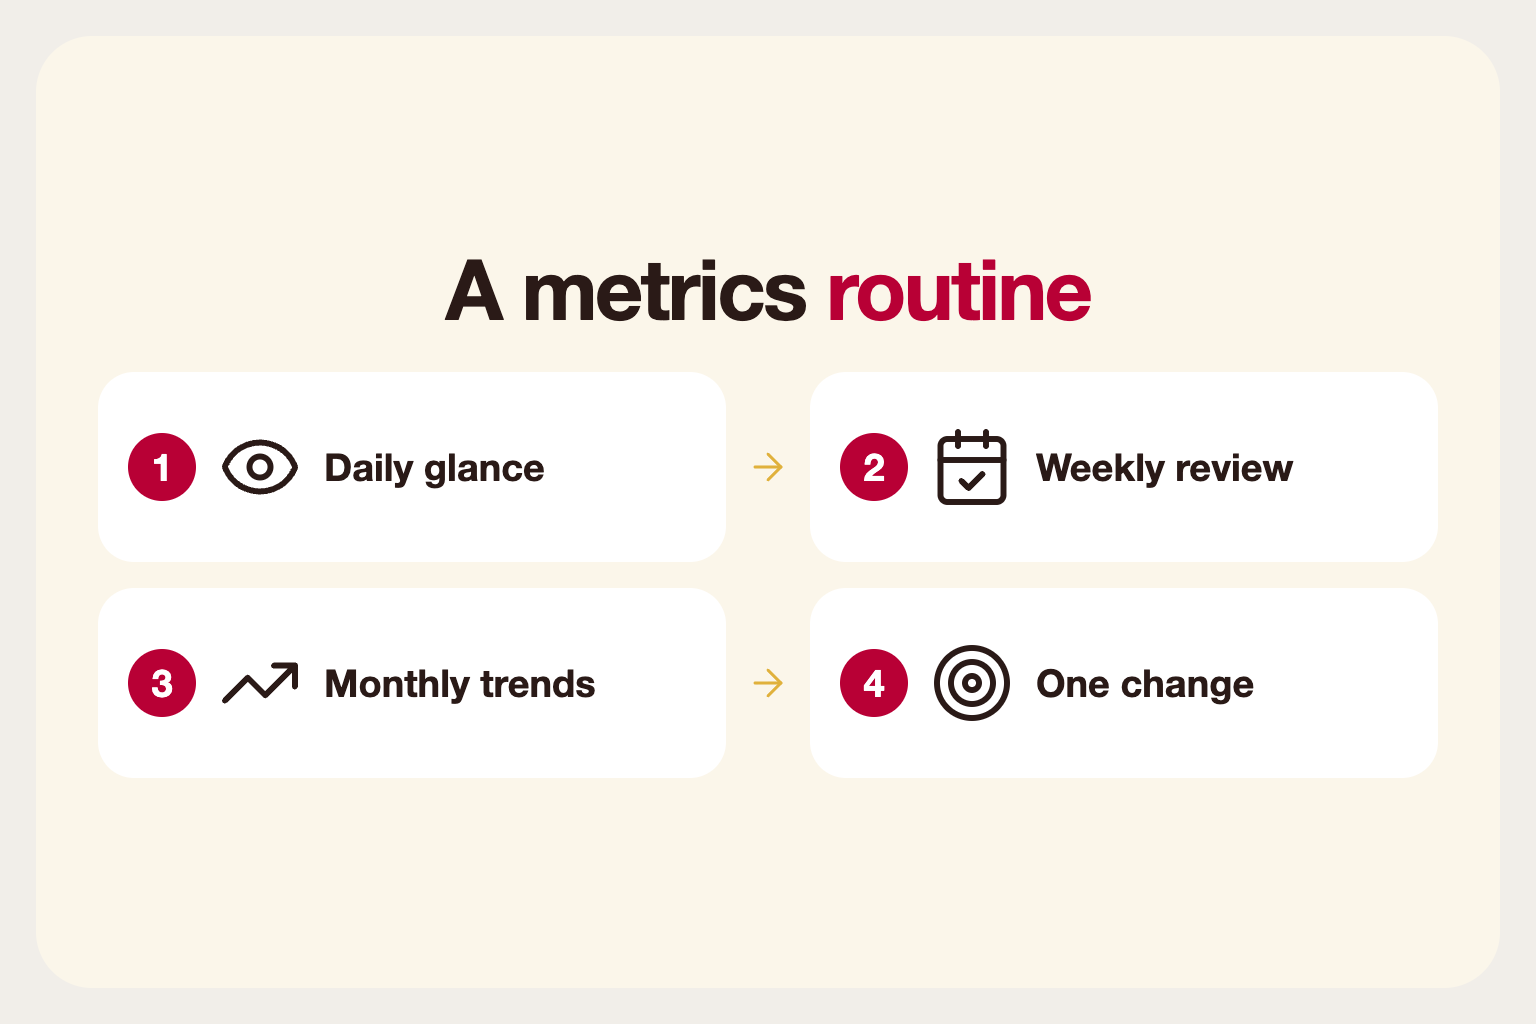
Look at the numbers on a regular schedule: a daily glance at sales, a weekly review of costs and speed, and a monthly look at trends. Regular reviews turn data into decisions.
Share the headline numbers with your team where appropriate. People work better when they know the target.
Beware of misleading numbers
A rising sales figure can hide falling margins. A busy week can be a one-off because of an event. Small samples can mislead. Always ask what else could explain a change before acting on it.
Compare similar periods and look at trends over several weeks, not single days, so you respond to patterns, not noise.
Make the data easy to reach
Numbers you have to dig for will not get looked at. Use a system that shows your key figures on one screen, and decide who reviews them and when. The easiest report to read is the one that gets used.
Keep your definitions consistent so numbers from different weeks are comparable.
Act on one thing at a time
Data is only useful if it leads to action. Choose one number to improve, make one change and watch the result. A single clear improvement is worth more than a dozen half-started ones.
Write down what you tried and what happened. Over a year, those notes become a guide to your own restaurant.